
Analyzing Biking Behavior using Bike-Sharing Data
🔍 Unlocking the Secrets of City Biking: What Chicago’s Bike-Share Data Tells Us
Have you ever wondered how people use bike-sharing systems in big cities? Do they ride to work, for fun, or both? And how do these patterns change over time? In our recent study, we dove deep into the massive data generated by Chicago’s Divvy bike-sharing system to uncover the hidden rhythms of urban biking. What we found not only reveals fascinating travel patterns but also offers insights into how cities can better manage and promote biking as a sustainable mode of transportation. 🚴♂️
🛠️ How We Did It: Turning Data into Insights
We analyzed over 2.3 million bike trips from July to December in 2013 and 2014. To make sense of this massive dataset, we used advanced clustering techniques to group similar trips together. Think of it like sorting a giant pile of puzzle pieces into smaller, more manageable groups that fit together. We focused on two main questions:
- How do biking patterns change based on time (weekdays vs. weekends) and user types (subscribers vs. casual customers)?
- Where and when do bike stations face the most demand for bikes and docks?
To answer these questions, we used a method called community detection, which helps identify clusters of similar trips. We also modeled over-demand patterns to understand which stations were most likely to run out of bikes or docks at specific times.

📊 What We Found: The Rhythms of Urban Biking
Our analysis revealed some striking patterns:
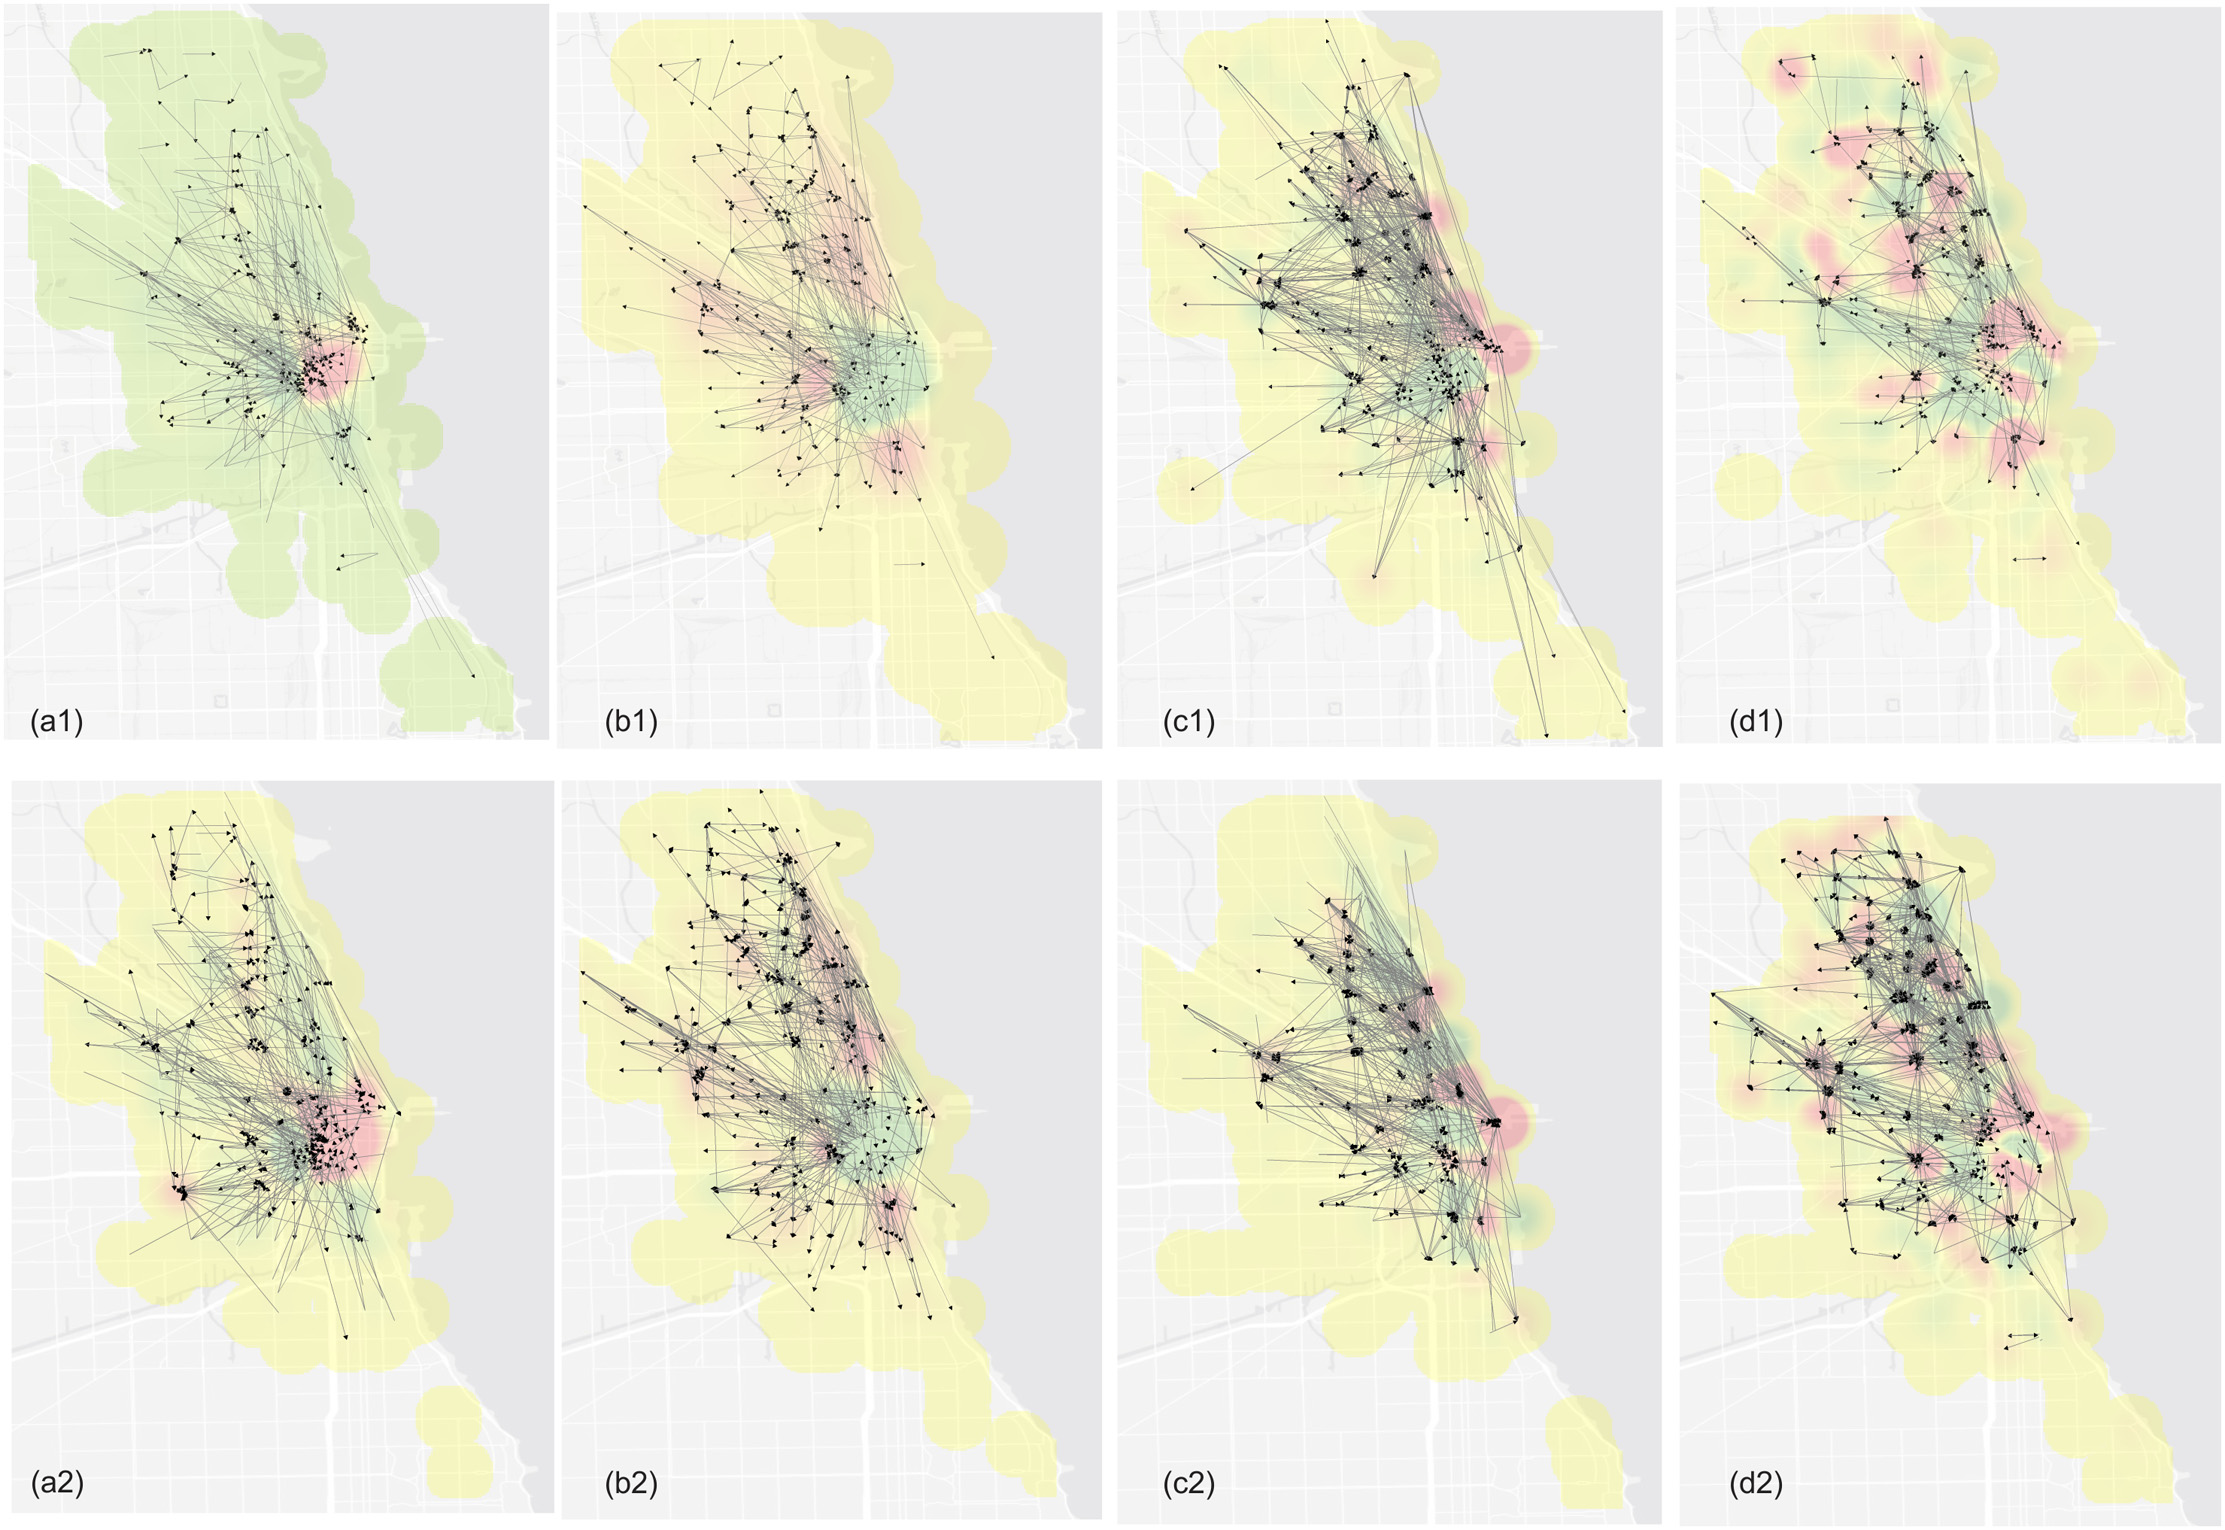
- Weekday Commutes: On weekdays, biking peaks during rush hours, with most trips flowing into downtown in the morning and outbound in the afternoon. This suggests that many people use Divvy bikes for their daily commute.
- Weekend Fun: On weekends, casual customers dominate, and their trips are more recreational, often concentrated around popular areas like Navy Pier and Lake Michigan.
- Gender Differences: Surprisingly, women tend to ride longer distances than men, especially on weekends.
We also identified specific stations that frequently faced over-demand for bikes or docks. For example, downtown stations often ran out of bikes in the morning and had full docks in the afternoon, while suburban stations showed the opposite pattern.
💡 Why This Matters: Building Better Bike-Sharing Systems
Our findings have important implications for city planners and bike-sharing operators. By understanding where and when demand is highest, cities can:
- Redistribute bikes more efficiently to meet demand.
- Design new bike lanes and facilities in high-traffic areas.
- Encourage more people to bike by addressing common frustrations, like empty or full stations.
Looking ahead, we’re excited to apply these methods to other cities and explore how biking patterns evolve over time. As bike-sharing systems continue to grow, understanding these patterns will be key to creating more sustainable, bike-friendly cities. 🌍
So, the next time you hop on a bike-share bike, remember: you’re part of a larger story, one that’s helping cities become greener, healthier, and more connected. 🚴♀️