Estimating Population Exposure to Fine Particulate Matter
🔍 Breathing Easy: Mapping Air Pollution Across the U.S.
Have you ever wondered how much air pollution you’re exposed to on a daily basis? Air pollution, particularly fine particulate matter (PM2.5), is a silent but serious threat to public health. These tiny particles, less than 2.5 micrometers in diameter, can penetrate deep into our lungs and even enter our bloodstream, leading to respiratory and cardiovascular diseases. But how do we measure and predict pollution levels in areas where monitoring stations don’t exist? That’s where our research comes in.
In this study, we tackled the challenge of estimating PM2.5 exposure across the contiguous United States. By combining advanced spatiotemporal interpolation methods with real-time air quality data, we created a powerful tool to visualize and predict pollution levels—helping us better understand how air quality impacts public health.
🛠️ How We Did It: The Science Behind the Maps
To estimate PM2.5 levels across the U.S., we used two main interpolation methods: Shape Function (SF)-based and Inverse Distance Weighting (IDW)-based approaches. Both methods aim to predict pollution levels at unmeasured locations by analyzing data from nearby monitoring stations. But here’s the twist: we didn’t just look at where the pollution was—we also considered when it happened. This spatiotemporal approach allowed us to create a more accurate picture of how air quality changes over time and space.
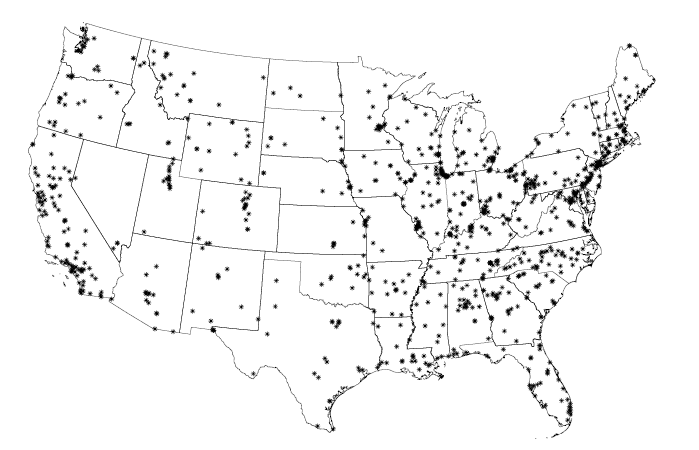
We tested these methods using data from the U.S. Environmental Protection Agency (EPA) AirNow program, which collects daily PM2.5 measurements from hundreds of monitoring sites across the country. To ensure our predictions were reliable, we used a technique called 10-fold cross-validation, where we repeatedly split the data into training and testing sets to evaluate the accuracy of our models.
📊 What We Found: SF vs. IDW
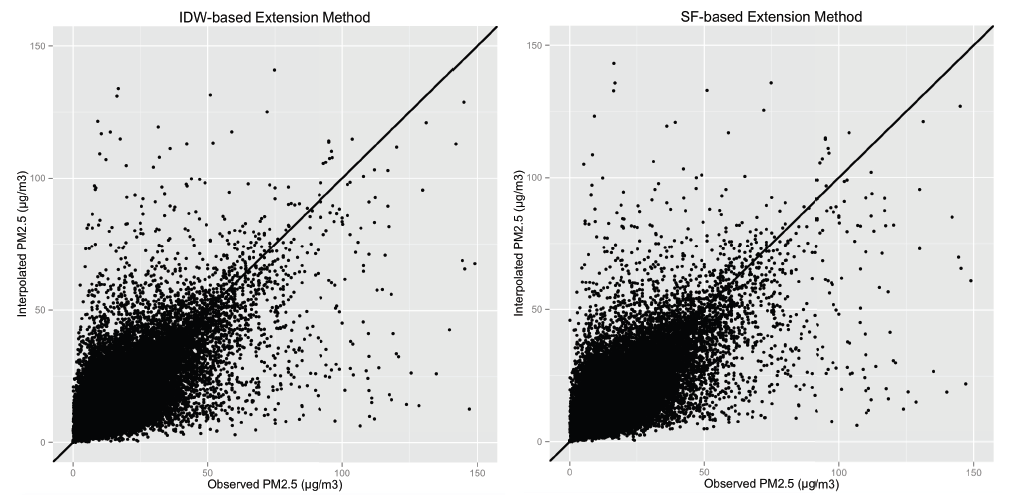
After crunching the numbers, we discovered that the SF-based method outperformed the IDW-based approach in most cases. The SF method had lower errors and provided more accurate predictions of PM2.5 levels, especially when we removed outliers—extreme values that could skew our results. For example, the SF method achieved a Mean Absolute Relative Error (MARE) of just 0.37, compared to 0.38 for the IDW method.
We also found that pollution levels vary significantly by season. Winter months tend to have higher PM2.5 concentrations, likely due to increased use of heating systems and stagnant air conditions. By mapping these seasonal trends, we identified areas where annual and daily PM2.5 levels exceeded EPA standards—putting millions of people at risk.
💡 Why This Matters: Protecting Public Health
Our research isn’t just about creating pretty maps—it’s about saving lives. By accurately estimating PM2.5 exposure, we can help policymakers identify high-risk areas and implement targeted interventions to reduce pollution. For example, our findings could inform decisions about where to place new air quality monitoring stations or how to allocate resources for pollution control programs.
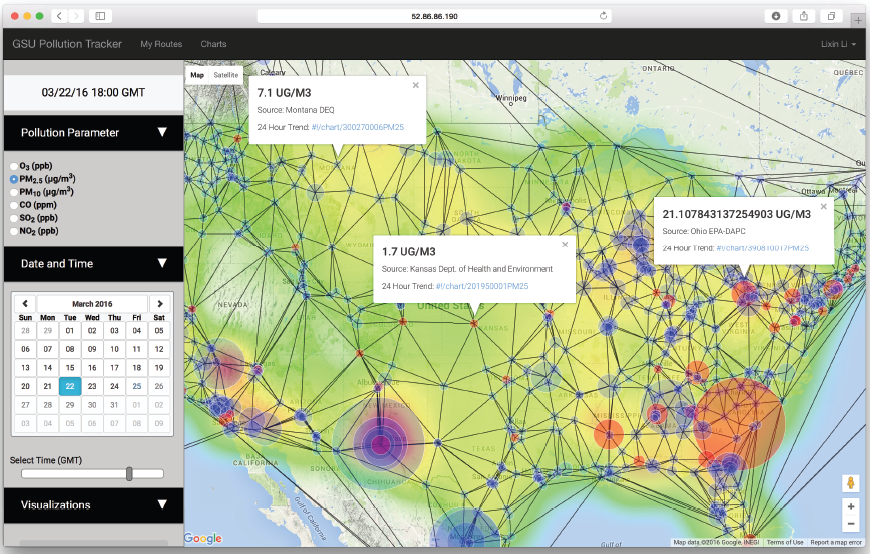
But we’re not stopping there. We’ve also developed a real-time web application that visualizes air pollution levels across the U.S. This tool allows anyone to explore how air quality changes over time and space, empowering communities to take action to protect their health.
Looking ahead, we plan to expand our research to include other pollutants and health outcomes. By linking our pollution estimates with health data, we hope to uncover new insights into how air quality impacts conditions like asthma, heart disease, and even cognitive decline. Together, we can breathe easier knowing that science is on our side.