
Improving Spatiotemporal Interpolation with Machine Learning
🔍 Why Air Pollution Mapping Matters
Air pollution is a silent threat to public health, and understanding its distribution is crucial for protecting communities. But how do we measure pollution levels in areas where we don’t have sensors? That’s where spatiotemporal interpolation comes in—a fancy term for estimating pollution levels at unsampled locations and times based on nearby measurements. In our latest research, we’ve taken this concept to the next level by combining cutting-edge machine learning with powerful big data tools. The result? A faster, more accurate way to map air pollution, which could help us better understand its impact on health.
🛠️ How We Did It: Machine Learning Meets Big Data
To tackle this challenge, we built on a classic method called Inverse Distance Weighting (IDW), which estimates values at unknown points by averaging nearby measurements, with closer points weighted more heavily. But here’s the twist: we added a time dimension to the mix, treating time as a special kind of space. This allowed us to model how pollution changes not just across locations but also over time.
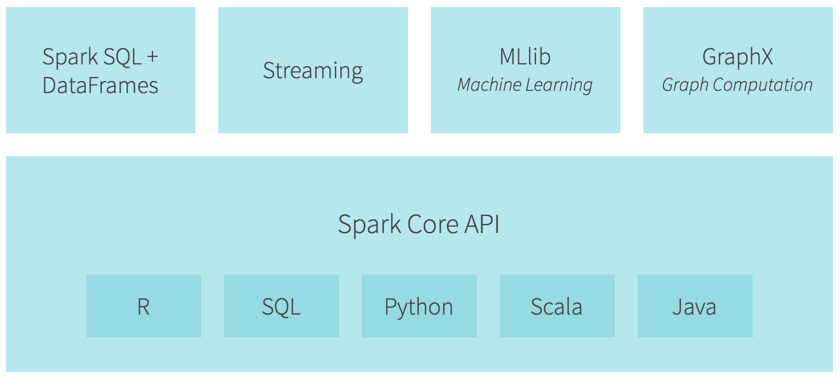
We then supercharged this approach using Apache Spark, a lightning-fast big data processing tool. By storing our data in a k-d tree (a clever way to organize spatial data) and distributing the work across multiple computers, we were able to test tens of thousands of parameter combinations in record time. This brute-force approach let us find the best settings for our model, something that would have been impossible with older methods.
📊 What We Found: Speed and Accuracy
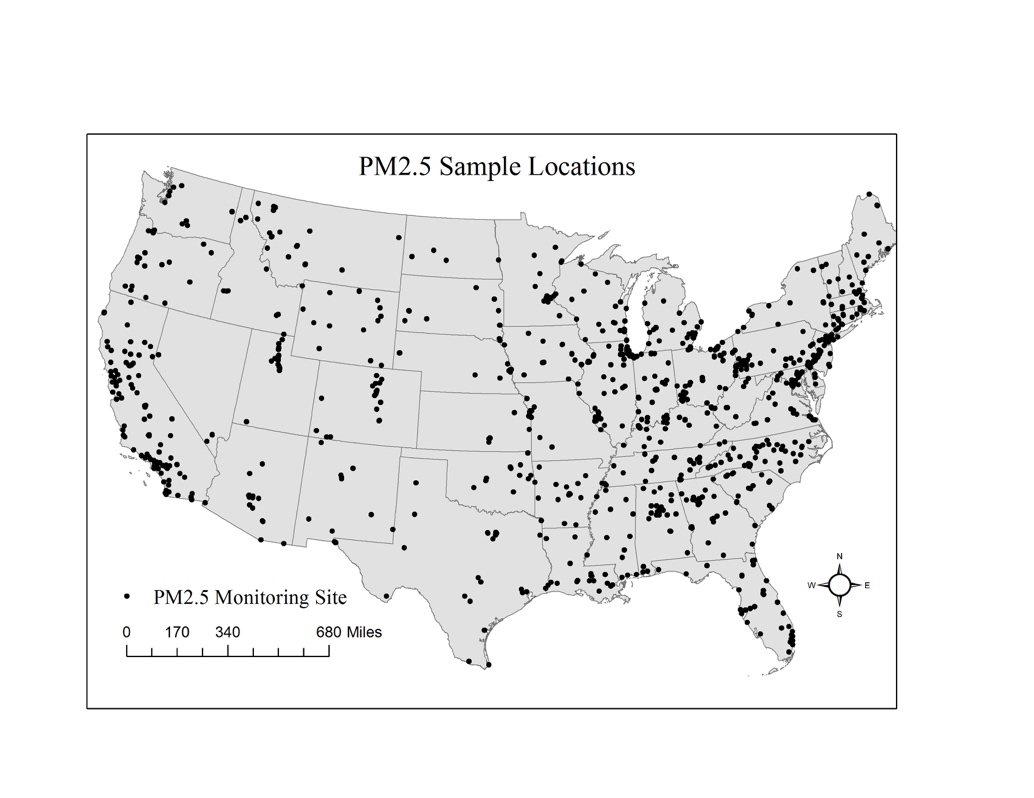
Our experiments focused on estimating daily PM2.5 levels (tiny pollution particles that can harm your lungs) across the U.S. using data from the EPA’s Air Quality System. Here’s what we discovered:
- Speed: Our method was 12 times faster than previous approaches when predicting pollution levels at county and census block group centroids.
- Accuracy: By searching for the optimal parameters, we improved the prediction accuracy significantly, achieving a mean absolute relative error (MARE) of 0.3791—better than the previous best of 0.3866.
For example, in one experiment, we tested over 16,000 parameter configurations in just 144.6 hours (thanks to Spark’s parallel processing). Without Spark, this would have taken over 4,600 hours—that’s more than half a year!
💡 What This Means for the Future
Our work isn’t just about making maps—it’s about making better decisions. By improving the accuracy and speed of pollution mapping, we can help policymakers and public health experts identify at-risk communities and take action to reduce exposure. But we’re not stopping here. Here’s what’s next:
- Wider parameter searches: We plan to explore even more parameter combinations to squeeze out every bit of accuracy.
- New machine learning methods: Techniques like random forests and leave-one-out cross-validation could further refine our models.
- Real-time data: We’re excited to apply our method to hourly pollution data from sources like AirNow, enabling near-real-time monitoring.
Ultimately, our goal is to establish clear links between air pollution and health outcomes, empowering communities to breathe easier. Stay tuned for more updates as we continue to push the boundaries of what’s possible with machine learning and big data!