
Investigating Children's Cities Play Spaces Perceptions
🔍 Why Do Kids Play Where They Play? Let’s Ask Them!
Have you ever wondered why kids choose certain places to play and avoid others? In a world where outdoor play is declining, especially in rapidly urbanizing cities, understanding where and why children play is more important than ever. We set out to explore this question in Yantai, China, a city undergoing rapid urbanization, by asking the experts themselves—children aged 10 to 13. Using a web-based participatory mapping tool, we let kids map out their favorite play spots and the places they avoid. What we found was both surprising and enlightening.
🛠️ How We Did It: Mapping Kids’ Play Worlds
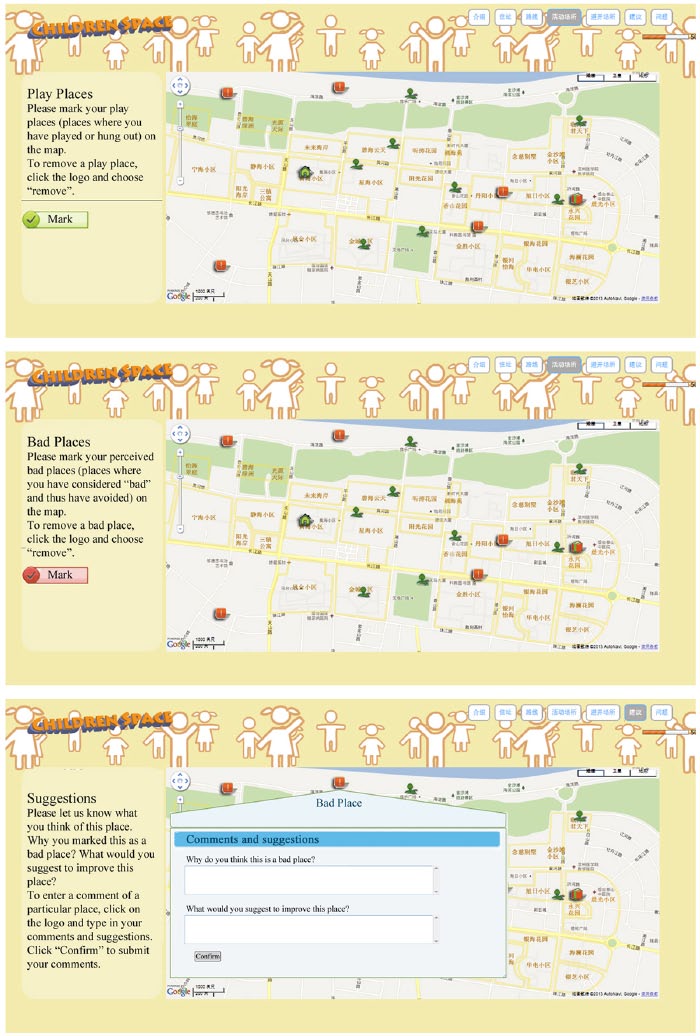
We wanted to give children a voice in urban planning, so we developed an interactive web-based mapping tool. Think of it like Google Maps, but designed specifically for kids to mark their favorite play spots and the places they avoid. Over 300 children participated, marking places they loved (like parks and beaches) and places they avoided (like busy streets or areas with poor air quality).
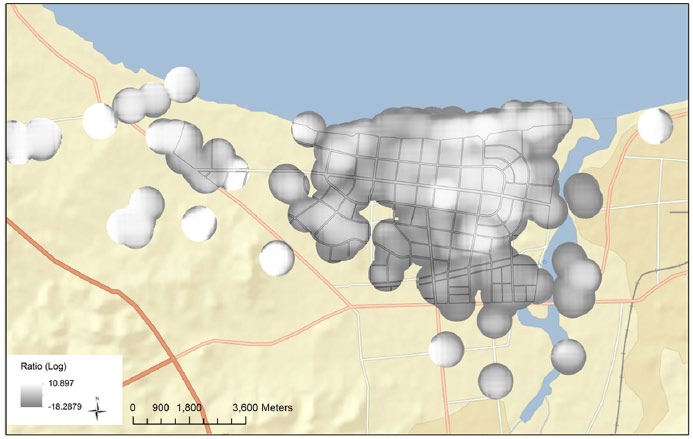
We also analyzed the spatial patterns of these places using advanced mapping techniques like kernel density estimation and ratio surface analysis. These methods helped us identify hotspots where kids love to play and areas they tend to avoid.
📊 What We Found: Play Clusters and Overlapping Perceptions
Our results showed that kids’ play places are clustered around existing public spaces like beaches, plazas, and parks. Interestingly, children living on the outskirts of the city had to travel much farther to reach these play spots compared to kids living closer to the city center. Boys also tended to travel longer distances than girls to reach their favorite play areas.
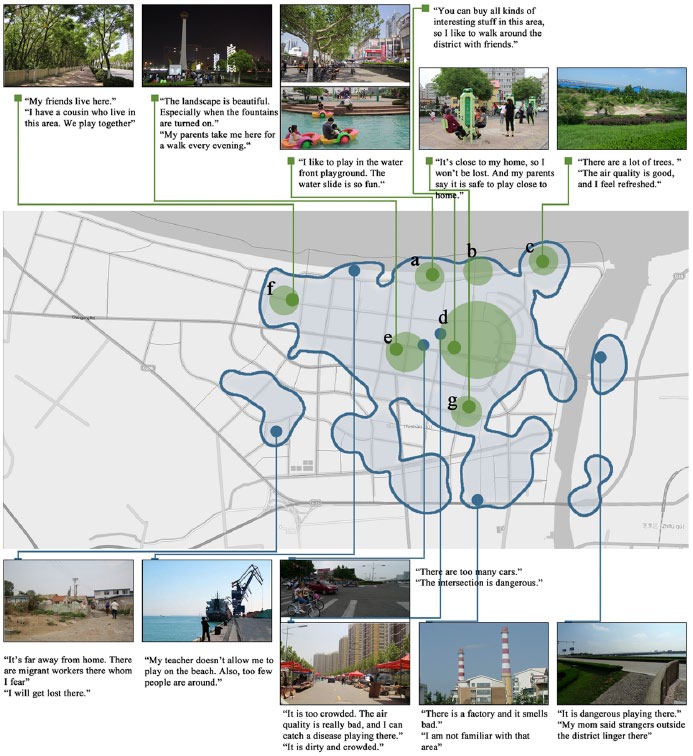
But here’s the twist: some places were both play spots and bad spots, depending on who you asked. For example, a bustling city plaza was a favorite hangout for some kids but avoided by others due to concerns about traffic and strangers. This overlap highlights the complexity of children’s perceptions—what’s fun for one child might be scary for another.
💡 What This Means for the Future: Designing Better Play Spaces
So, what did kids tell us about their favorite play spots? They love places that are close to home, visually attractive, and full of social opportunities. On the flip side, they avoid places with heavy traffic, poor air quality, or unfamiliar surroundings. These insights are crucial for urban planners and designers who want to create spaces that encourage outdoor play.
Our study also demonstrates the power of participatory mapping as a tool to involve children in urban planning. By giving kids a platform to share their experiences, we can create cities that are not only functional for adults but also fun and safe for children. Moving forward, we hope to expand this approach to other cities and age groups, ensuring that children’s voices are heard in the design of their environments.
After all, shouldn’t cities be designed for everyone—including the youngest among us?