Land Surface Temperature and Land-Use Change
How Urbanization is Heating Up Our Cities: A Deep Dive into Kunming's Thermal Landscape 🌡️
🔍Why Should We Care About Urban Heat?
Imagine stepping out of your air-conditioned home into a wall of heat. Now, imagine that heat isn’t just a summer annoyance—it’s a year-round reality for millions of people living in rapidly growing cities. This phenomenon, known as the urban heat island (UHI) effect, is a growing concern as cities expand and natural landscapes are replaced by concrete jungles. In our recent study, we set out to understand how urbanization is reshaping the thermal environment of Kunming, a rapidly developing city in southwest China. What we found has implications for cities worldwide.
🛠️How We Studied Urban Heat
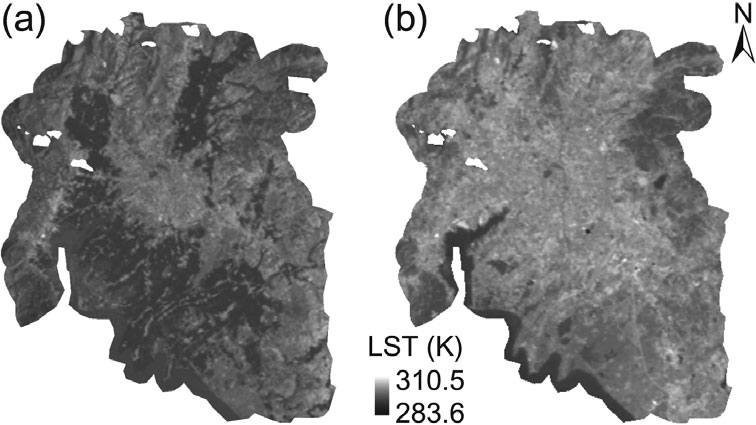
To uncover the relationship between urbanization and rising temperatures, we turned to satellite imagery and advanced mapping techniques. Using Landsat images from 1992 and 2006, we analyzed changes in land surface temperature (LST)—a key indicator of how hot the ground feels. We also classified land-use types, such as built-up areas, forests, and water bodies, to see how these changes influenced temperature patterns.
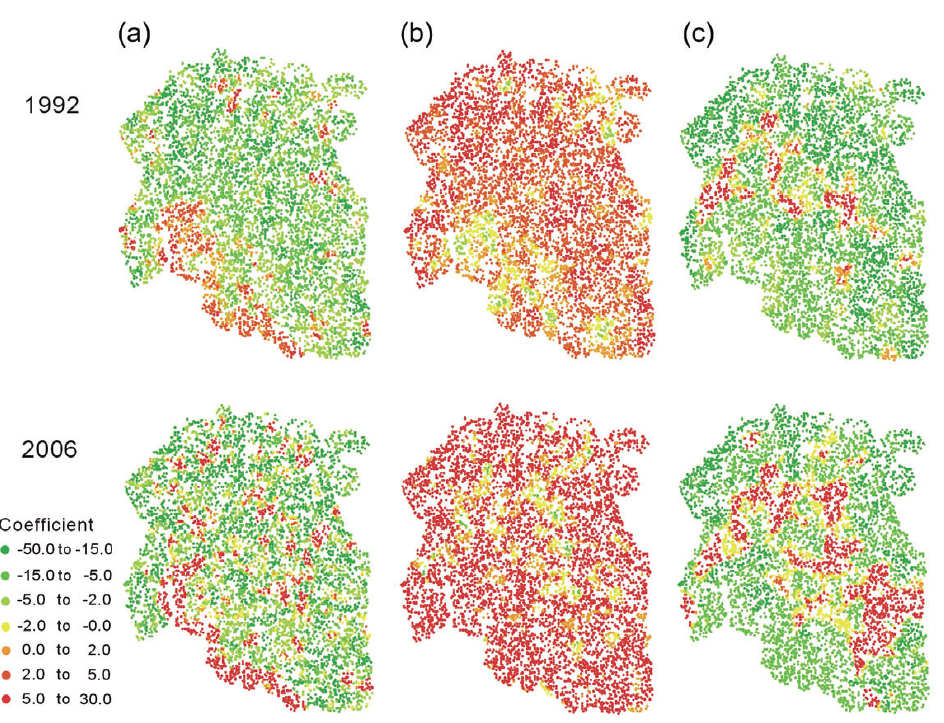
One of the coolest tools we used was geographically weighted regression (GWR), a method that lets us see how the relationship between land use and temperature varies across different parts of the city. Think of it like a heat map that not only shows where it’s hot but also explains why it’s hot in those specific areas.
What We Discovered
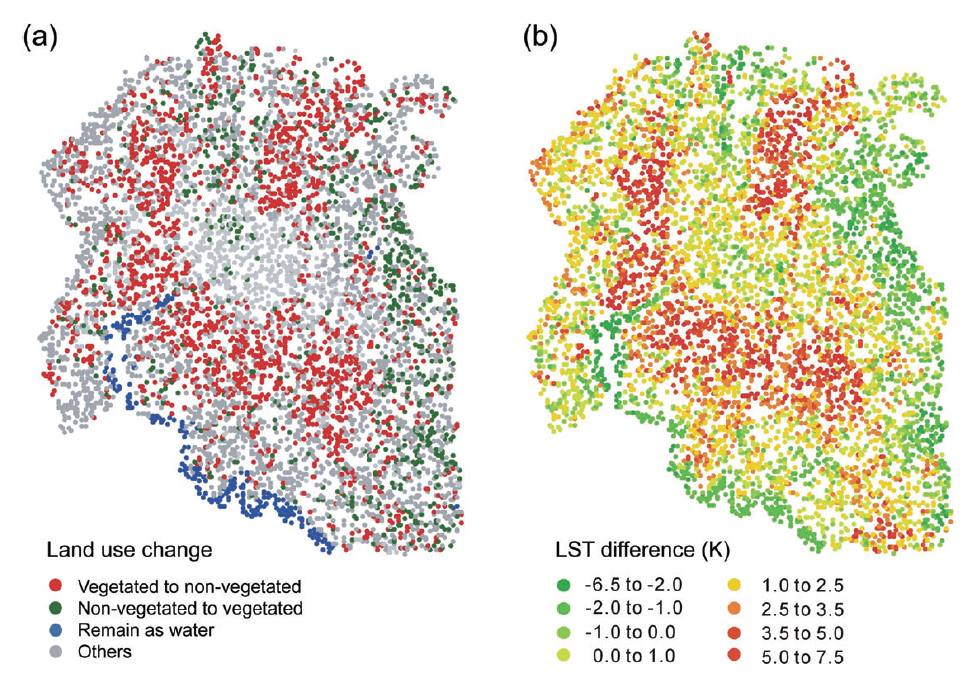
Our findings were striking. Between 1992 and 2006, Kunming’s urban core and surrounding areas saw a significant rise in temperatures. Built-up and barren lands were the hottest, while water bodies and green spaces acted as natural coolants. For example, areas with dense vegetation were up to 3-4°C cooler than urbanized zones. This highlights the critical role of green spaces in mitigating urban heat.
We also found that converting natural landscapes into urban areas had a dramatic impact. For instance, when forests were turned into built-up areas, temperatures rose by an average of 3.4°C. On the flip side, turning barren land into green spaces helped cool things down.
What This Means for the Future
Our study underscores the importance of thoughtful urban planning. As cities continue to grow, incorporating green spaces and water bodies isn’t just about aesthetics—it’s about creating livable environments. Kunming’s efforts to introduce urban parks and green corridors have already shown promise in reducing local temperatures. These findings could serve as a blueprint for other cities grappling with the UHI effect.
Looking ahead, we’re excited to explore how emerging technologies, like high-resolution satellite imagery and machine learning, can further enhance our understanding of urban heat dynamics. By combining these tools with on-the-ground data, we hope to develop even more precise models to guide sustainable urban development.
Urbanization doesn’t have to mean hotter cities. With the right strategies, we can build cities that are not only vibrant and thriving but also cool and comfortable for everyone. 🌿